WOUDC Contributor Guide (Version 2.1.3)
2019-10-02
Foreward
This document describes the procedures for data submission and information about file format, structure, and content for both ozone data and ultraviolet data for the World Ozone and Ultraviolet Data Centre (WOUDC). This guide is intended for use by both data originators (for data submission) and clients (information about reading data files). The current version of this guidebook is a combination of two separate documents; one for data submissions related to ozone data and one for data submissions related to ultraviolet data. This guidebook unifies them in order to provide more clear and consistent documentation.
The WOUDC website is used to update information and serves as a virtual “bulletin board”. As this guide is further developed, use the website to retrieve the latest version.
Table of Contents
- 1.1 Intended Audience
- 1.2 Purpose
- 1.3 Document Location
- 1.4 Document History and Update
- 1.5 Website
- 1.6 Contributing to WOUDC
Chapter 2 Data Submission Procedure
- 2.1 Contributor Registration
- 2.2 Station Registration
- 2.3 Data Submission
- 2.3.1 Upload Guidelines
- 2.4 Data Type
Chapter 3 Standard Data Format
- 3.1 The WOUDC Data Format Standard
- 3.1.1 Extended CSV syntax Rules
- 3.1.2 File Naming Convention
- 3.2 The WOUDC extCSV Data File Metadata
- 3.2.1 Introduction
- 3.3 Ozone Specific Data Content
- 3.3.1 Introduction
- 3.3.2 Category: Lidar
- 3.3.3 Category: Microwave
- 3.3.4 Category: Ozonesonde
- 3.3.5 Category: TotalOzoneObs
- 3.3.6 Category: TotalOzone
- 3.3.7 Category: UmkehrN14
- 3.4 Ultraviolet Specific Data Content
- 3.4.1 Introduction
- 3.4.2 Category: Spectral
- 3.4.3 Category: Multiband
- 3.4.4 Category: Broadband
- 3.4.5 Category: Pyranometer
- 3.4.6 Ancillary and Auxiliary Data
- 3.5 Software
- 4.1 Data Policy
- 4.2 Data Flow and Processing
Chapter 6 Access and Data Retrieval
- 7.1 Contact Page
- 7.2 Address
- A.1 Lidar Example
- A.2 Microwave Example
- A.3 Ozonesonde Example
- A.4 TotalOzoneObs Example
- A.5 TotalOzone Example
- A.6 UmkehrN14 Example
- A.7 Spectral Example
- A.8 Multiband Example
- A.9 Broadband Example
- A.10 Pyranometer Example
Chapter 1 Introduction
The World Ozone and Ultraviolet Data Centre (WOUDC) began as the World Ozone and Data Centre (WODC) starting in 1960. In 1922, Environment Canada agreed to accept solar ultraviolet radiation data and the data centre was renamed to the WOUDC. The WOUDC is operated by the Meteorological Service of Canada, a branch of Environment and Climate Change Canada.
The WOUDC operates under the auspices of the Global Atmosphere Watch (GAW) programme of the World Meteorological Organization (WMO). The WOUDC gets guidance from the WMO Science Advisory Groups (SAGs) for issues related to both ozone and UV.
1.1 Intended Audience
This document is intended for use by data centre contributors. This guidebook can also be useful for data centre users and the WOUDC operator.
1.2 Purpose
The purpose of this document is to describe the procedures for data submissions to the WOUDC. This includes, but is not limited to:
- contributor registration
- station registration
- data submission
- supported contributor file formats and descriptions
As the WOUDC is further developed, this guide will be updated accordingly and will continue to be posted electronically on the WOUDC website. The WOUDC website is used to update information and serve as a virtual “bulletin board”. As this guide is further developed, use the website to retrieve the latest version.
1.3 Document Location
The canonical location of this document is https://guide.woudc.org. In the event of discrepancy, the document location is to be considered normative.
1.4 Document History and Update
In the past, the contributor’s guidebook had been split into two different guidebooks: one for ozone data submissions [1] and one for ultraviolet data submissions [2]. This guidebook unifies them in order to provide more clear and consistent documentation.
1.5 Website
The WOUDC website is location at https://woudc.org and provides a web-based application to disseminate ozone and ultraviolet radiation data, derived products and metadata.
1.6 Contributing to WOUDC
The WOUDC is the standard archive for ozone and ultraviolet data. By contributing data to the WOUDC, a contributor leverages the following benefits:
- No cost, authoritative, independent storage and backup of their data
- 24/7 web-based public access to their data via numerous data access mechanisms providing enhanced user experience as well as multi-application machine access
- Value added discovery, visualization and access capabilities for their data using international standards
- Value added products created from their data, such as geospatial/GIS data formats, maps, and graphs
In order for a contributor to be eligible to submit data, they must:
- Be registered with the WOUDC (as well as GAW which is strongly recommended)
- have their station registered with the WOUDC (and preferably GAW)
- have the data types that the WOUDC processes (ozone data and ultraviolet data) in the extCSV file format
If the data being submitted is not of ozone or ultraviolet, it may be eligible to be part of one of the other 5 world data centres:
- World Data Centre for Precipitation Chemistry http://www.qasac-americas.org
- World Data Centre for Aerosols http://ebas.nilu.no
- World Radiation Data Centre http://wrdc.mgo.rssi.ru/wrdc_en_new.htm
- World Data Centre for Remote Sensing of the Atmosphere http://wdc.dlr.de
- World Data Centre for Greenhouse Gases http://ds.data.jma.go.jp/gmd/wdcgg
Chapter 2 Data Submission Procedure
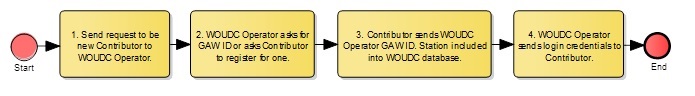
2.1 Contributor Registration
The application process consists of 4 steps:
- A new contributor sends a request to WOUDC stating their interest in being a contributor
- The data centre operator will check the request and direct the contributor to either provide WOUDC the station GAW ID or to complete the registration process from GAWSIS to obtain a GAW ID
- Once the contributor has a valid GAW ID, the contributor will provide that ID to the data centre operator to complete the new station registration process by including the station into the WOUDC database
- Once the station is included in the WOUDC database, the data centre operator will send a new, private, FTP login credential to the contributor for use to upload data
A flow chart highlighting the contributor registration procedure can be found in Figure 1.
2.2 Station Registration
Once a contributor has registered with the WOUDC as indicated in section 2.1, additional stations or amendments to existing station information can be registered by submitting a new GAW ID or updating station information with GAWSIS:
- Contributor to obtain a new GAW ID for new station or make amendments to existing station through GAWSIS
- Contact WOUDC with the change request for adding a new station or making amendments to an existing station. Provide GAW ID to operator
- Operator includes new station into the WOUDC database or updates existing station
2.3 Data Submission
The WOUDC provides a File Transfer Protocol (FTP) capability for contributors to submit data. The WOUDC FTP site is located at ftp://ftp.woudc.org. The site requires username and password credentials in order to transfer data to the WOUDC.
!!! md-alert “” Note: the FTP site does not provide data access capabilities (see Data Access).
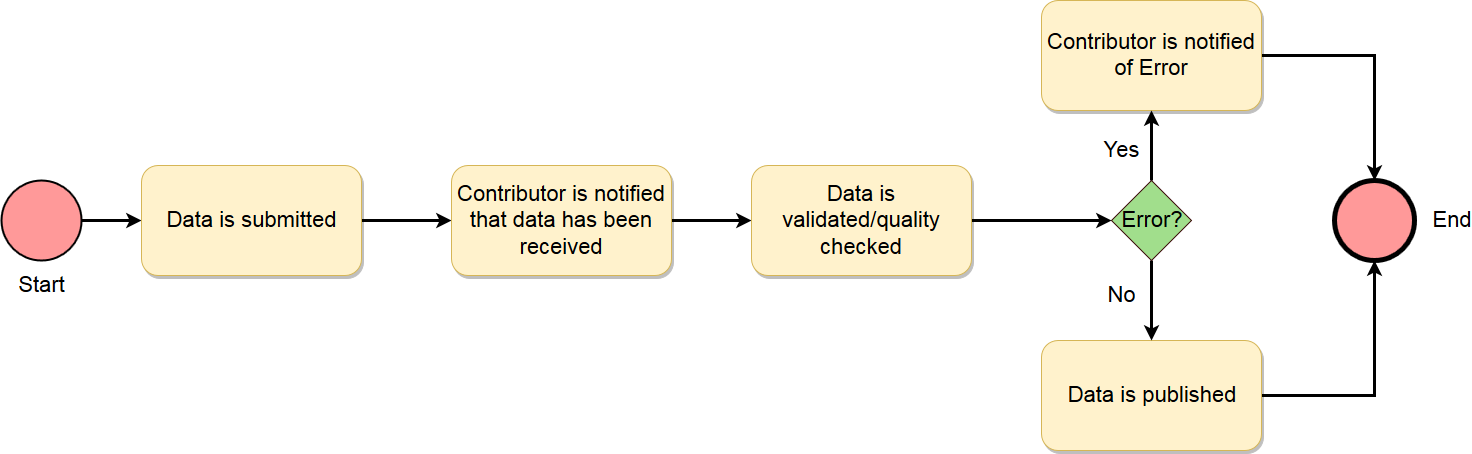
Once a contributor has been registered:
- The contributor uploads data in extCSV format to the FTP site
- The WOUDC sends email to contributor acknowledging receipt of uploaded data (acknowledgments are sent each morning at 0400 UTC.)
- Once per week (on Monday), the WOUDC collects data from the FTP for processing, validates the contributor, site and instrument information and processes the data into the WOUDC database.
- If issues are discovered during validation or processing, a report will be emailed to the contributor so that the submission can be corrected and re-uploaded.
- If no validation or processing issues are found, data will be published on the website and available for download from the WOUDC website, geospatial web services or Web Accessible Folder (WAF). (Typically within 24hrs.)
A flow chart highlighting the data submission procedure can be found in Figure 2.
!!! md-alert “” Note: The details of transferring files with FTP depend on your computer’s operating system and FTP client software.
2.3.1 Upload Guidelines
The WOUDC FTP site allows contributors to upload data files in any directory/folder. However, directories with the following conventions will be ignored for processing final data (Extended CSV files):
/calibration: submission area for calibration data/level-0: submission area for raw data/provisional: submission area for preliminary (not final) data/values
These directory/folder names are reserved for specific workflows for near-real time or raw data ingest/processing. Contributors are encouraged to create and use these directory/folder names to upload calibration, level 0, or provisional data only.
Extended CSV files can be uploaded in any other directory including the root of the contributor’s login area.
2.4 Data Types
Presently, the following data categories are defined:
Ozone
- Lidar
- Microwave
- Ozonesondes
- TotalOzone
- Umkehr
Ultraviolet
- Spectral
- Multiband
- Broadband
- Pyranometer
Chapter 3 Standard Data Format
3.1 The WOUDC Data Format Standard
The WOUDC uses an ASCII text format that leverages the Comma Separated Values (CSV) format. The UTF-8 character set encoding is required for data submissions. The WOUDC “extended” CSV (or extCSV) format provides the ability to specify multiple tables, multiple fields, table comments, file level comments, and table groupings (grouping tables into sets) within a single CSV. The extCSV file format supports both metadata information and high resolution (temporal and spatial) data. The WOUDC requires originators of data to submit their data using this standard format to assist in the efficient processing of data sets.
ExtCSV files are divided into two main parts: a metadata section and a data content section. The metadata section can be considered a data file “header” as this portion is common to all files within the WOUDC in terms of table format and content. The data portion will be unique to the individual data categories (or types) such as total ozone or ozonesonde.
The extCSV files provide a common format that is independent of the type of instrument and the data type (Ozone/Ultraviolet and sub types as listed in 2.4). The extCSV format is not produced directly by the instruments, but by further processing of instrument data to produce standard extCSV files. The following Field Names are used by WOUDC to distinguish between instrument data versus WOUDC extCSV format, or the “level of processing” of a data file:
- level-0: “Raw” or unprocessed data directly from the Instrument. For example, “B-file” format ozone files produced by the Brewer operating software (http://kippzonen-brewer.com/wp-content/uploads/2014/10/KippZonen_Service_Manual_Brewer_MKIII_V1206-1.pdf). These files are not read or processed by WOUDC directly, but are used by software such as O3Brewer (http://www.o3soft.eu/doc/o3brewer.pdf)
- level-0.5: Data in WOUDC extCSV format, produced by the contributor. Level-0.5 files contain all of the station, data type, and other identifying information or metadata of a measurement session in a single file, in a standard format. These files are typically produced by the contributor by formatting level-0 data and adding the appropriate metadata sections to comply with extCSV standards. Unlike level-1, level-0.5 may contain preliminary data that is not ready for publication as level-1. Raw instrument data such as level-0 but with extCSV headers and metadata for example, could be considered level-0.5
- level-1: Data in WOUDC extCSV format, produced and quality controlled by the contributor. The level-1 files contain all of the station, data type, and other identifying information or metadata of a measurement session in a single file, in a standard format. These files are typically produced by the contributor by formatting level-0 data and adding the appropriate metadata sections. For example, O3Brewer software (http://www.o3soft.eu/doc/o3brewer.pdf) will produce WOUDC extCSV (level-1) files from Brewer “B-file” (level-0) files
- level-2: level-2 data is level-1 data (WOUDC extCSV format) that has been further processed (such as interpolated, re-gridded, smoothed or other) for analysis, or input into other software etc. For example, UMKEHR level-2 files are produced by additional processing of level-1 files. (level-2 data is indicated within extCSV files by a “2” in the level field of the CONTENT table. See Sec. 3.2.1.1)
3.1.1 Extended CSV syntax Rules
The main file format used by the WOUDC is an extended Comma Separated Value (extendedCSV or extCSV for short) which extends the standard CSV syntax rules to support comments and multiple data content (tables) within individual files. Since the extCSV formats in plain text (ASCII), they are platform/OS neutral and thus can be imported easily into many analytical tools.
An extCSV file consists of two sections: a metadata header and data tables. The metadata header has rigid format and content rules, but the data tables are designed to be more flexible, specific to a given data type.
The following are the extended CSV syntax rules:
- Fields are seperated by comma characters (,) and the field width is variable
- If a field name or its value contains either comma (,) or double-quote (“) characters, then the entire field must be enclosed within double-quote (“) characters when written
- NULL values are represented as empty fields (,,) and blank lines are ignored
- Lines beginning with an asterisk (*) are comments
- Lines beginning with a pound (#) symbol are table names
- The first record following the
#TABLENAMErecord specifies column (field) names. Each data column (field) requires a name separated by a comma
Example:
* The following data are simulated...
#TABLENAME
Field1, Field2, Comment
12,35.6,Clear sky.
12.5,,Thunderstorm (can't measure Y).
13,55.5,"It's raining, it's pouring!"
13.5,70,"Better start ""The Ark""."
The following are the WOUDC content rules:
- Table names are written in UPPERCASE and denoted by the pound (#) symbol as the first character. Field names are case-sensitive
- A table is comprised of three sections: a table name, column (field) names, and one or more data records. Tables can also contain optional table comments
- Trailing nulls are assumed for unspecified data attributes
- Each file must contain only one (single) instance of the static metadata tables (
#CONTENT,#DATA_GENERATION,#INSTRUMENT, and#PLATFORM) and apply to all data within the file - Each file must contain at least one instance of the dynamic metadata tables (
#LOCATION, and#TIMESTAMP) and are applied until they are re-stated. Class content that use the fields of these tables can modify the attributes (i.e., time can be updated by individual samples) - Further information about site conditions, meteorology, sky images, etc. may be included as comments or by other tables generated at the discretion of the data originator. For example, if a data originator wishes to indicate an occurrence of a special note (“instrument was bumped while sampling”) then a comment is reasonable. Dynamic variations occurring instantaneously such as meteorology (e.g. sky or wind conditions) or the reporting of calibration data would be represented in a table
Example:
#TABLENAME
Field1,Field2,Field3
Datum1,Datum2,Datum3
*Table comment
Example:
#SITE_METEOROLOGY
Date,Time,Temperature,Pressure,WindDirection,WindSpeed
3.1.2 File Naming Convention
The following file naming convention is recommended:
{TIMESTAMP.Date}.{INSTRUMENT.Name}.{INSTRUMENT.Model}.{INSTRUMENT.Number}.{DATA_GENERATION.Agency}.csv
Where:
TIMESTAMP.Date: start date of observations in file (format YYYYMMDD)INSTRUMENT.Name: Common name of instrument. For example, the Brewer spectrophotometer is called the ‘Brewer’ whereas the Brewer-Mast ozonesonde is called the ‘Brewer-Mast’. Refer to the WOUDC website for a listing: https://woudc.org/data/instrumentsINSTRUMENT.Model: Model ID where applicable. Refer to the WOUDC instrument list: https://woudc.org/data/instrumentsINSTRUMENT.Number: Serial number of the instrument as assigned by the manufacturerDATA_GENERATION.Agency: The acronym of the submitting Agency
Note that WOUDC does not enforce file naming conventions as part of data submissions.
3.2 The WOUDC extCSV Data File Metadata
3.2.1 Introduction
The WOUDC header includes the metadata information that is common in all of the WOUDC data files. The uniqueness of each field within the header is required such that if a duplicate data file is received, one or more of the header variables would have to have changed in order for this file to be accepted into the data archive.
Table 3.2-1 and Table 3.2-2 outline the tables required in all the WOUDC data files (Table Name column) and their respective field names (Field Names column). In section 3.2.1.1 to section 3.2.1.6, there are more thorough descriptions of what each field name for a particular table entails.
Table 3.2-1 - Static Metadata (only one occurence or instance per file)
| Table Name | Field (Column) Names |
|---|---|
#CONTENT |
Class, Category, Level, Form |
#DATA_GENERATION |
Date, Agency, Version, ScientificAuthority |
#PLATFORM |
Type, ID, Name, Country, GAW_ID |
#INSTRUMENT |
Name, Model, Number |
Table 3.2-2 - Dynamic Metadata (at least one required per file; multople occurences are permitted)
| Table Name | Field (Column) Names |
|---|---|
#LOCATION |
Latitude, Longitude, Height |
#TIMESTAMP |
UTCOffset, Date, Time |
!!! md-alert “” Note: Contributors can optionally include revision history within an extCSV file by documenting within a comment block at the end of the file. Revision dates must be in descending order (latest date first).
3.2.1.1 Content
Class: The general type of data to follow; WOUDC would be used here.
Category: Sub group of data submitted (i.e., Ozonesonde or Lidar)
Level: The Level refers to the data product. Acceptable values are “1” for data that has been formatted into WOUDC extCSV format (and therefore ready for submission to WOUDC), or “2” for data that has also been interpolated, re-gridded or otherwise processed. (Note that level is not the same as Version as described in 3.2.1.2 – Version is used to indicate the “revision” of a file, where Level is used to indicate the “processing stage” of a file. (There may be several versions of both level-1 and level-2 files).
Form: The version of the data format to follow. The initial specification for the FORM (value=1) refers to the basic table descriptions. If an existing table is altered or a new table added, the FORM index will be increased. For example, a data table already defined with form=1, with a specific number of columns, then the addition of one or more columns to that table would require the Form value to be incremented by one for each change. The FORM (index) value is intended as a file format reader indicator of the type of data tables to follow, to assist programmers with reading the file. Changes to this index will be made through the WOUDC only.
3.2.1.2 Data Generation
Date: Date when the files was processed or generated. Date is represented in the ISO 8160 format standard, i.e., YYYY-MM-DD. Example: 2015-12-31.
Agency: The acronym of the submitting Agency.
Version: Data version specified by the submitting Agency. These versions have the form “major.minor” (e.g., 3.2) where major values are incremented with a./ changes to data file metadata or b./ the processing algorithm. Minor values are incremented when the characterisation or calibration values have changed. Note: minor values are reset to zero with changes to the processing algorithm.
ScientificAuthority: The person(s) responsible for the data quality at the submitting Agency.
3.2.1.3 Platform
Type: Type of observing platform: Stationary (STN) or Moving (e.g., Airborne (FLT), Ship borne (SHP), etc.). The default is STN.
ID: Unique station or flight ID assigned by the WOUDC to each registered platform.
Name: Platform Name (requested that an ASCII character name be used)
Country: The country where the platform is located using the three-letter ISO-3166 code (e.g., Finland is FIN, Switzerland is CHE, etc.).
GAW_ID: three-letter GAW ID as issued by GAWSIS, if available (recommended).
3.2.1.4 Instrument
Name: Common name of instrument. For example, the Brewer spectrophotometer is called the “Brewer” wheras the Brewer-Mast ozonesonde is called the “Brewer-Mast”. Refer to the WOUDC website for a listing: https://woudc.org/data/instruments.
Model: Model ID where applicable. Refer to the WOUDC instrument list: https://woudc.org/data/instruments
Number: Serial number of the instrument as assigned by the manufacturer
3.2.1.5 Location
Latitude: Latitude of the instrument. Typically an instrument is located at a fixed location and shares the platform latitude. The format is decimal degrees (deg.) to two significant decimals places with North positive and South negative.
Longitude: Longitude of the instrument. Typically an instrument is located at a fixed location and shares the platform longitude. The format is decimal degrees (deg.) to two significant decimals places with East positive and West negative.
Height: Height is defined as the altitude, elevation, or height of the defined platform + instrument above sea level. Typically an instrument is located at a fixed location and shares the platform elevation. The format is metres above sea level (m.a.s.l.).
3.2.1.6 Timestamp
UTCOffset: The UTCOffset is the amount of time to be subtracted from the local time in order to obtain UTC time (where East is positive and Local Time as defined by the data originator). UTCOffset is represented in the ISO-8601 standard of hh:mm:ss. The default is to report time in UTC, thus UTCOffset=+00:00:00. If Time is not given in UTC in the Data Content section, then Time represents local time and the UTCOffset must be specified by a non-zero value.
!!! md-alert “” Note: This is equivalent to UTC = time - UTCOffset.
Date: Date is represented in the ISO 8160 format standard, i.e., YYYY-MM-DD, corresponding to the time code. Example: 2015-12-31. Time: Time is represented in the ISO-8601 standard of hh:mm:ss.
3.2.1.7 Example
Below is an example of a header. This header includes all the required header tables and fields, as well as comments.
*SOFTWARE: SNDPRO 1.3
*TROPOPAUSE IN MB 320
*M.S.C.-O3 T1200

#CONTENT
Class,Category,Level,Form
WOUDC,OzoneSonde,1.0,1

#DATA_GENERATION
Date,Agency,Version,ScientificAuthority
1999-05-07,MSC,1.0,Jonathan Davies

#PLATFORM
Type,ID,Name,Country,GAW_ID
STN,315,Eureka,CAN,71917

#INSTRUMENT
Name,Model,Number
ECC,6a,6a2355

#LOCATION
Latitude,Longitude,Height
79.99,-85.94,10

#TIMESTAMP
UTCOffset,Date,Time
+00:00:00,1999-04-28,23:15:00
3.2.1.8 Metadata Table Configuration
Below is a table that summarizes the required tables in WOUDC-EXTCSV file for different datasets.
Table 3.2-3 - Required tables for different datasets
| Dataset | Table Name | Required/Optional | Number of Occurences | Incompatible |
|---|---|---|---|---|
| All | #CONTENT |
Required |
1 |
N/A |
| All | #DATA_GENERATION |
Required |
1 |
N/A |
| All | #PLATFORM |
Required |
1 |
N/A |
| All | #INSTRUMENT |
Required |
1 |
N/A |
| All | #LOCATION |
Required |
1 |
N/A |
Broad-band |
#TIMESTAMP |
Required |
1 |
N/A |
Broad-band |
#DIFFUSE |
Required |
1 |
#GLOBAL |
Broad-band |
#GLOBAL |
Required |
1 |
#DIFFUSE |
Lidar |
#TIMASTAMP |
Required |
1 |
N/A |
Lidar |
#OZONE_SUMMARY |
Required |
1+ |
N/A |
Lidar |
#OZONE_PROFILE |
Required |
1+ |
N/A |
Multi-band |
#TIMESTAMP |
Required |
1 |
N/A |
Multi-band |
#GLOBAL |
Required |
1 |
#SIMULATANEOUS |
Multi-band |
#SIMULATANEOUS |
Required |
1 |
#GLOBAL |
OzoneSonde |
#TIMESTAMP |
Reqiured |
1 |
N/A |
OzoneSonde |
#FLIGHT_SUMMARY |
Required |
1 |
N/A |
OzoneSonde |
#PROFILE |
Required |
1 |
N/A |
OzoneSonde |
#AUXILIARY_DATA |
Optional |
1 |
N/A |
OzoneSonde |
#PUMP_CORRECTION |
Optional |
1 |
N/A |
Spectral |
#TIMESTAMP |
Optional |
1+ |
N/A |
Spectral |
#GLOBAL_SUMMARY_NSF |
Required |
1+ |
#GLOBAL_SUMMARY |
Spectral |
#GLOBAL_SUMMARY |
Required |
1+ |
#GLOBAL_SUMMARY_NSF |
Spectral |
#GLOBAL |
Required |
1+ |
N/A |
TotalOzone |
#TIMESTAMP |
Required |
2 |
N/A |
TotalOzone |
#DAILY |
Required |
1 |
N/A |
TotalOzone |
#MONTHLY |
Optional |
1 |
N/A |
TotalOzone |
#SAOZ_DATA_V2 |
Optional |
1 |
N/A |
TotalOzoneObs |
#TIMESTAMP |
Required |
1 |
N/A |
TotalOzoneObs |
#OBSERVATIONS |
Required |
1 |
N/A |
TotalOzoneObs |
#DAILY_SUMMARY |
Required |
1 |
N/A |
UmkehrN14 |
#TIMESTAMP |
Required |
2 |
N/A |
UmkehrN14 |
#N14_VALUES |
Required |
1 |
N/A |
UmkehrN14 level 2 |
#TIMESTAMP |
Required |
2 |
N/A |
UmkehrN14 level 2 |
#C_PROFILE |
Required |
1 |
N/A |
3.3 Ozone Specific Data Content
3.3.1 Introduction
This section discusses the data content of the various categories of Ozone data. Each category has a set of defined tables which includes the fields (columns) names, the order of the fields, and the required units.
3.3.1.1 Lidar
Lidar is an abbreviated term for Light Detection and Ranging. This is remotely sensed data where the temporal range per file is the duration of one observation period (usually one local or two days yielding a single profile).
3.3.1.2 Microwave
Microwave contains information on vertical ozone profile. This is remotely sensed data where the temporal range per file is the duration of one observation period (usually one local or two days yielding a single profile).
3.3.1.3 Ozonesonde
Ozonesonde is a balloon-borne ozone instrument used to vertically profile the ozone amount in the atmosphere. This is remotely sensed data where the temporal range per file is the duration of sonde flight (typically a single flight).
3.3.1.4 TotalOzoneObs
TotalOzoneObs (total ozone observations) is total column ozone measurements measured in the Dobson Units. This is remotely sensed data where the temporal range per file is usually within one local day.
3.3.1.5 TotalOzone
TotalOzone (total ozone) is total column ozone measurements measured in the Dobson Units. This is remotely sensed data where the temporal range per file is one month of daily summaries.
3.3.1.6 UmkehrN14
UmkehrN14 is For Umkehr measurements using 14 N-values (representing 14 solar zenith angles). This is remotely sensed data where the temporal range per file is in one month of daily summaries.
3.3.2 Category: Lidar
There are two tables required for the Lidar Category: #PROFILE_SUMMARY, and #OZONE_PROFILE.
!!! md-alert “” Note: the Lidar tables have been directly extracted from the NASA-Ames 2160 formatted files [3, 4] used by Network for the Detection of Atmospheric Composition Change (NDACC) known formerly as NDSC.
Table 3.3-1 outlines the tables needed for the category Lidar (column Table Name) and their respective field names. In section 3.3.2.1 to section 3.3.2.2, there are more thorough descriptions of what each field name for a particular table entails.
Table 3.3-1 - Category Lidar data tables
| Table Name | Field (Column) Names (in order) |
|---|---|
#PROFILE_SUMMARY |
Altitudes, MinAltitude, MaxAltitude, StartDate, StartTime, EndDate, EndTime, PulsesAveraged |
#OZONE_PROFILE |
Altitude, OzoneDensity, StandardError, RangeResolution, AirDensity, Temperature |
3.3.2.1 PROFILE_SUMMARY
Altitudes: Number of retrieved levels (layers) reported.
MinAltitude: Minimum altitude of profile in meters (m).
MaxAltitude: Maximum altitude of profile in meters (m).
StartDate: Start date determined by the observation period. ISO 8601 format for date yyyy-mm-dd is used.
StartTime: Start time determined by the observation period. ISO 8601 format for time hh:mm:ss is used.
EndDate: End date determined by the observation period. ISO 8601 format for date yyyy-mm-dd is used.
EndTime: End time determined by the observation period. ISO 8601 format for time hh:mm:ss is used.
PulsesAveraged: Number of pulses used to integrate profile.
3.3.2.2 OZONE_PROFILE
Altitude: altitude (range) in metres (m).
OzoneDensity: Ozone density (concentration) (molecules*cm-3).
StandardError: Estimated standard error of ozone concentration (molecules*cm-3).
RangeResolution: Range resolution in metres (m).
AirDensity: Density of the air (molecules*cm-3).
Temperature: Temperature (Kelvin).
3.3.2.3 Example
Example format for a Lidar data file can be found in Appendix A.1 as well as online at https://woudc.org/archive/Documentation/Examples-extCSV/Lidar.csv.
3.3.3 Category: Microwave
There are two tables required for the Microwave Category: #PROFILE_SUMMARY, and #OZONE_PROFILE.
!!! md-alert “” Note: the Microwave tables are based on the data output from the Payerne, Switzerland meteorological station, operated by MeteoSwiss [5].
Table 3.3-2 outlines the tables needed for the category Microwave (column Table Name) and their respective field names. In section 3.3.3.1 to section 3.3.3.2, there are more thorough descriptions of what each field name for a particular table entails.
Table 3.3-2 - Category Microwave data tables
| Table Name | Field (Column) Names (in order) |
|---|---|
#PROFILE_SUMMARY |
Levels, AveragingTime, ZenithAngle, NoiseTemperature, TTF, CalculatedSpectrum |
#OZONE_PROFILE |
Altitude, OzoneVMR, VariableError, FixedError, SmoothingError, TotalError, A-priori, Temperature, Pressure |
3.3.3.1 PROFILE_SUMMARY
Levels: Number of levels (layers) reported
AveragingTime: Averaged time
ZenithAngle: Solar zenith angle (decimal degrees)
NoiseTemperature: Mean system noise temperature (K)
TTF: Tropospheric Transmission Factor (TTF)
CalculatedSpectrum: State of measure - calculated spectrum (K)
3.3.3.2 OZONE_PROFILE
Altitude: in metres above sea level (m.a.s.l.)
OzoneVMR: Ozone VMR in ppm
VariableError: Variable (stochastic) error for ozone VMR (ppm)
FixedError: Fixed (systematic) error for ozone VMR (ppm)
SmoothingError: Smoothing error (ppm)
TotalError: Total error (ppm)
A-priori: A-priori data contribution (%)
Temperature: Temperature profile used for retrieval (K)
Pressure: Pressure profile used for retrieval (Pa)
3.3.3.3 Example
Example format for a Microwave data file can be found in Appendix A.2.
3.3.4 Category: Ozonesonde
There are 2 tables required for the Ozonesonde Category: #FLIGHT_SUMMARY and #PROFILE.
There are 10 tables that are optional for the Ozonesonde Category: #PREFLIGHT_SUMMARY, #RADIOSONDE, #INTERFACE_CARD, #SAMPLING_METHOD, #PUMP_SETTINGS, #PUMP_CORRECTION, #OZONE_REFERENCE, #PROFILE_UNCERTAINTY, #PRELAUNCH, and #DESELECTED_DATA.
!!! md-alert “”
Note: There is an alternation to the header metadata where table name #CONTENT in the FORM field name shall be equal to two. The reason this change is occurring: FORM (index) is the version of the data format. If an existing table is altered or a new table added, the FORM index will be increased by one for each change. The form (index) value is intended as a file format reader indicator of the type of data tables to follow, to assist programmers with reading the file. Changes to this index will be made through the WOUDC only. Consequently the additional and altering of the original tables in the ozonesonde format the FORM index value needs to change, in this case it shall be equal to two as of “Month Day, 2013”. For details, please refer to Section 3.2.1.1.
Table 3.3-3 outlines the tables needed for the category Ozonesonde (column Table Name) and their respective field names. In section 3.3.4.1 to section 3.3.4.12, there are more thorough descriptions of what each field name for a particular table entails. Section 3.3.4.13 includes two code tables: Table 3.3-4 - Residual Ozone (Correction) Algorithm Codes and Table 3.3-5 - Level Codes.
Table 3.3-3 - Category Ozonesonde data tables
| Table Name | Field (Column) Names (in order) |
|---|---|
#PREFLIGHT_SUMMARY |
Ib0, ib1, ib2, SolutionType, SolutionVolume, PumpFlowRate, OzoneSondeResponseTime |
#RADIOSONDE |
Manufacturer, Model, Number |
#INTERFACE_CARD |
Manufacturer, Model, Number |
#SAMPLING_METHOD |
TypeOzoneFreeAir, CorrectionWettingFlow, SurfaceOzone, DurationSurfaceOzoneExposure, LengthBG, WMOTropopausePressure, BurstOzonePressure, GroundEquipment, ProcessingSoftware |
#PUMP_SETTINGS |
MotorCurrent, HeadPressure, VacuumPressure |
#PUMP_CORRECTION |
Pressure, PumpCorrectionFactor |
#FLIGHT_SUMMARY |
IntegratedO3, CorrectionCode, SondeTotalO3, NormalizationFactor, BackgroundCorrection, SampleTemperatureType |
#OZONE_REFERENCE |
Name, Model, Number, Version, TotalO3, WLCode, ObsType, UTC_Mean |
#PROFILE |
Duration, Pressure, O3PartialPressure, Temperature, WindSpeed, WindDirection, LevelCode, GPHeight, RelativeHumidity, SampleTemperature, SondeCurrent, PumpMotorCurrent, PumpMotorVoltage, Latitude, Longitude, Height |
#PROFILE_UNCERTAINTY |
As in #PROFILE |
#PRELAUNCH |
As in #PROFILE |
#DESELECTED_DATA |
As in #PROFILE |
3.3.4.1 PREFLIGHT_SUMMARY
Ib0: Background current of ozonesonde measured in the laboratory before sonde is exposed to ozone (µA).
Ib1: Background current of ozonesonde measured in the laboratory after sonde is exposed to defined dose of ozone (µA).
Ib2: Background current of ozonesonde measured at the field site just prior to launch (µA).
SolutionType: Chemical composition of sensing solution of ozonesonde.
SolutionVolume: Volume of sensing solution in ozonesonde cell (ml).
PumpFlowRate: Pump flow rate measured in the laboratory at surface conditions (corrected for moistening when possible: see section 3.2.4 of GAW Report #201 - http://www.wmo.int/pages/prog/arep/gaw/documents/GAW_201.pdf) (cm^3/min ).
OzonesondeResponseTime: Response time 1/e (in minutes) measured during the laboratory decay test.
3.3.4.2 RADIOSONDE
Manufacturer: Manufacturer of radiosonde flown with the ozone sensor.
!!! md-alert “” Note: In the in the January 2013, GAW Report #201, Quality Assurance and Quality Control for Ozonesonde Measurements in GAW, Section 4.8.2, page 45; this field name “Manufacturer” is known as “Name”.
Model: Radiosonde model.
Number: Radiosonde serial number.
3.3.4.3 INTERFACE_CARD
Manufacturer: Manufacturer of interface card between radiosonde and ozone sensor.
!!! md-alert “” Note: In the in the January 2013, GAW Report #201, Quality Assurance and Quality Control for Ozonesonde Measurements in GAW, Section 4.8.2, page 45; this field name “Manufacturer” is known as “Name”.
Model: Interface card model.
Number: Interface card serial number.
3.3.4.4 SAMPLING_METHOD
TypeOzoneFreeAir: Technique used to obtain ozone free air at the launch site just prior to launch (example would be “activated charcoal filter”).
CorrectionWettingFlow: Factor applied to pump flow rate to compensate for using nonsaturated air during pre-flight calibration.
SurfaceOzone: Surface ozone measured by independent method (ppbv).
DurationSurfaceOzoneExposure: Length of time ozonesonde was measuring (i.e. exposed to) surface ozone (min).
LengthBG: Distance (length) between the bottom of the balloon and the sonde payload or gondola (m).
WMOTropopausePressure: Ambient air pressure at the tropopause which is determined after WMO-definition (hPa).
BurstOzonePressure: Ozone partial pressure at balloon burst altitude (hPa).
GroundEquipment: Basic ground equipment in use.
ProcessingSoftware: Post flight processing software.
3.3.4.5 PUMP_SETTINGS
MotorCurrent: Electrical current through pump motor (mA).
HeadPressure: Maximum pressure when outlet of pump is stopped (hPa).
VacuumPressure: Minimum pressure when inlet of pump is stopped (hPa).
3.3.4.6 PUMP_CORRECTION
Pressure: Level Pressure in hecto-Pascals (hPa).
PumpCorrectionFactor: Correction applied to pump flow rate at corresponding pressure level.
3.3.4.7 FLIGHT_SUMMARY
IntegratedO3: Integrated ozone amount from launch platform to burst altitude (DU).
CorrectionCode: Code for the algorithm used to estimate the remaining ozone (calculated residual) above burst height to the top of atmosphere. (Refer to Table 3.3-4 in Section 3.3.4.13).
SondeTotalO3: Integrated + calculated residual (DU).
NormalizationFactor: The factor that the apparent ozone partial pressure measured by the sonde was multiplied by in order to make the SondeTotalO3 value agree with the TotalO3 given in the #OZONE_REFERENCE table. A negative factor indicates a value that was calculated but not applied.
BackgroundCorrection: The method used to account for the background current produced by the ozonesonde when no ozone is present.
SampleTemperatureType: The method used to calculate the temperature of the air being sampled by the ozonesonde. This can be an estimated value, a constant, or a measurement from a thermistor located in the box, pump or inlet tube.
3.3.4.8 OZONE_REFERENCE
Name: Common name of the total ozone reference instrument, for example “Brewer” or “TOMS”. Refer to the WOUDC website for a listing: https://woudc.org/data/instruments.
Model: Model ID where applicable. Refer to the WOUDC Instrument list: https://woudc.org/data/instruments.
Number: Serial number of the instrument as assigned by the manufacturer.
Version: Data version specified by the submitting Agency. These versions have the form “major.minor” (eg. 3.2) where major values are incremented with changes to the processing algorithm and minor values are incremented when the characterisation or calibration values have changed.
!!! md-alert “” Note: minor values are reset to zero with changes to the processing algorithm.
TotalO3: Daily value of total column ozone amount (in Dobson Units, i.e., milli atm-cm) defined as the “best representative value” (typically in the order of DS, ZS and FM).
WLCode: Code to designate the wavelength pair(s) used for total ozone measurement. (Refer to Table 3.3-7 in Section 3.3.5.3).
ObsType: Code to designate the type of total ozone measurement. (Refer to Table 3.3-7 in Section 3.3.5.3).
UTC_Mean: The mean time of observations (in decimal hours, UTC).
3.3.4.9 PROFILE
Duration: Elapsed flight time since released as primary variable (s).
Pressure: Atmospheric pressure of each level in hecto-Pascals (hPa).
O3PartialPressure: Level partial pressure of ozone in milli-Pascals (mPa).
Temperature: Level Temperature in degrees Celsius (C).
WindSpeed: Wind speed in meters per second (m/s).
WindDirection: Wind direction in degrees.
LevelCode: Code for the level type. (Refer to Table 3.3-5 in Section 3.3.4.13).
GPHeight: Geopotential height in meters (m).
RelativeHumidity: Relative Humidity in percent (%).
SampleTemperature: Temperature where sample is measured in degrees Celsius (C).
SondeCurrent: Measured ozonesonde cell current (µA) with no corrections applied.
PumpMotorCurrent: Electrical current (mA) measured through the pump motor (if available).
PumpMotorVoltage: Applied voltage (V) measured across the pump motor (if available).
Latitude: Geographical latitude (for example from GPS) (-90 to +90 decimal degrees).
Longitude: Geographical longitude (for example from GPS) (-180 to +180 decimal degrees).
Height: Geographical height (for example from GPS) (meter above sea level - masl).
3.3.4.10 PROFILE_UNCERTAINTY
Have estimated uncertainty (if available) for each of the measured profile parameter in #PROFILE as a function of duration.
Duration: Elapsed flight time as primary variable (s).
Pressure: Atmospheric pressure of each level in hecto-Pascals (hPa).
O3PartialPressure: Level partial pressure of ozone in milli-Pascals (mPa).
Temperature: Level Temperature in degrees Celsius (C).
WindSpeed: Wind speed in meters per second (m/s).
WindDirection: Wind direction in degrees.
LevelCode: Placeholder for future use, leave as blank.
GPHeight: Geopotential height in meters (m).
RelativeHumidity: Relative Humidity in percent (%).
SampleTemperature: Temperature where sample is measured in degrees Celsius (C).
SondeCurrent: Measured ozonesonde current (no corrections applied).
PumpMotorCurrent: Electrical current (mA) measured through the pump motor (if available).
PumpMotorVoltage: Applied voltage (V) measured across the pump motor (if available).
Latitude: Geographical latitude (for example from GPS) (-90 to +90 degrees).
Longitude: Geographical longitude (for example from GPS) (-180 to +180 degrees).
Height: Geographical height (for example from GPS) (meters above sea level - masl).
3.3.4.11 PRELAUNCH
Any data recorded by telemetry (i.e. data acquisition) system prior to sonde release including pre-launch checks and surface measurements.
Duration is relative to launch time (time before launch in seconds) and is therefore a negative value. All the other table parameters are consistent with #PROFILE_UNCERTAINTY table (section 3.3.4.10).
3.3.4.12 DESELECTED_DATA
Any data recorded from the Ozonesonde but not reported in the #PROFILE table.
This can include data that was rejected due to suspected telemetry or instrument problems; and data recorded after balloon termination (a descent profile). The table parameters are the same as in #PROFILE_UNCERTAINTY table (section 3.3.4.10). O3PartialPressure may be calculated but is not mandatory.
3.3.4.13 Code Tables
Table 3.3-4 - Residual Ozone (Correction) Algorithm Codes
| Correction Code | Algorithm |
|---|---|
| None (blank) | Unknown |
| 0 | None |
| 1 | Satellite derived climatology from SBUV. (after (McPeters, R.D., Labow, G.J., and Johnson, B.J. 1997 in JGR) |
| 2 | Constant mixing ratio extrapolated from value at burst height. The Residual Ozone (D.U.) = 7.892 * ozone partial pressure (mPa) at burst level. |
| 3 | Constant mixing ratio extrapolated from average of last 3 significant levels above 17 mbar (MSC method). The Residual Ozone (D.U.) = 7.892 * Total atmospheric pressure * (Average mixing ratio of last three levels) (mPa) |
| 4 | Constant mixing ratio extrapolated from value at burst height. The Residual Ozone (D.U.) = 7.892 * ozone partial pressure (mPa) at burst level. However, the height of the extrapolation is limited to 7 hPa. If the balloon reaches a height beyond 7 hPa, the profile is integrated up to 7 hPa and then the ozone partial pressure, at that point (if it is a good datum), is multiplied by 7.892. If the balloon bursts below 7 hPa then the profile is extrapolated from the burst point. |
| 5 | Monthly mean vertical ozone profile climatology is calculated specifically for Lauder using Lauder ozone microwave radiometer data from 1992 to 1998. The climatology is similar to the McPeters/Labow climatology in that it is listed in 1 hPa increments from 30 to 1 hPa. |
| 6 | Climatology 2011: An MLS and sonde derived ozone climatology for satellite retrieval algorithms. (After McPeters, R.D., and Labow G.J., in JGR 2012). |
| 7-98 | To be defined by WOUDC |
| 99 | Other (not yet defined) Supplied by data originator. |
Table 3.3-5 - Level Codes
| Level Code | Description |
|---|---|
| None (blank) | Unknown |
| 0 | None |
| 1 | Standard level: The 15 standard WOUDC levels are: 1000, 700, 500, 300, 200, 150, 100, 70, 50, 30, 20, 10, 7, 5, 3, 2 and 1 (hPa). |
| 2 | Significant level: Surface, tropopause or other significant inflection point for ozone, temperature etc. |
| 3 | Standard and Significant Level. |
| 4 | Level average |
| Other codes | Further codes will be generated as required using the following simple model: <p></p>Level Code - Description: <table><tr><td>8</td><td>significant for temperature</td></tr><tr><td>16</td><td>significant for ozone</td></tr><tr><td>32</td><td>significant for RH</td></tr> </table>E.g. a standard level which is significant for temperature and ozone would be 1+2+8+16 = 27 |
3.3.4.14 Example
Example format for an Ozonesonde data file can be found in Appendix A.3 as well as online at https://woudc.org/archive/Documentation/Examples-extCSV/Ozonesonde.csv.
3.3.5 Category: TotalOzoneObs
There are two tables required for the TotalOzoneObs Category: #OBSERVATIONS, and #DAILY_SUMMARY.
Table 3.3-6 outlines the tables needed for the category TotalOzoneObs (column Table Name) and their respective field names. In section 3.3.5.1 to section 3.3.5.2, there are more thorough descriptions of what each field name for a particular table entails. Section 3.3.5.3 includes two code tables: Table 3.3-7 - Wavelength Codes and Table 3.3-8 - Observation Codes.
Table 3.3-6 - Category TotalOzoneObs data tables
| Table Name | Field (Column) Names (in order) |
|---|---|
#OBERVATIONS |
Time, WLCode, ObsCode, Airmass, ColumnO3, StdDevO3, ColumnSO2, StdDevSO2 |
#DAILY_SUMMARY |
WLCode, ObsCode, nObs, MeanO3, StdDevO3 |
3.3.5.1 OBSERVATIONS
Time : hh:mm:ss
WLCode: Code to designate the wavelength pair(s) used for total ozone measurement. Codes 0-7 are used for Dobson instruments only, 8 for Filter instruments only and 9 for Brewer instruments only. Refer to Table 3.3-7 in section 3.3.5.3.
ObsCode: Code to designate the type of total ozone measurement. Refer to Table 3.3-8 in section 3.3.5.3.
Airmass: Relative slant path through atmosphere.
ColumnO3: Discrete total column ozone (O3) amount (in Dobson Units, i.e., milli atm-cm) measured at the time of observation.
StdDevO3: Standard Deviation of total column ozone measurement (where applicable).
ColumnSO2: Discrete total column sulphur dioxide (SO2) amount (in Dobson units, i.e., milli atm-cm) measured at the time of observation.
StdDevSO2: Standard Deviation of total column SO2 measurement (where applicable).
3.3.5.2 DAILY_SUMMARY
WLCode: Code to designate the wavelength pair(s) used for total ozone measurement. Codes 0-7 are used for Dobson instruments only, 8 for Filter instruments only and 9 for Brewer instruments only. Refer to Table 3.3-7 in section 3.3.5.3.
ObsCode: Code to designate the type fo total ozone measurement. Refer to Table 3.3-8 in section 3.3.5.3.
nObs: Number of observations used to calculate the total column ozone value.
MeanO3: Mean value of total column ozone (O3) amount (in Dobson Units, i.e., milli atm-cm).
StdDevO3: Standard Deviation of total column ozone measurement (where applicable). (For DS, and ZS the maximum deviation defaults to 5.0, for FM, default is 12.0. See Table 3.3-8 - Observation Codes in section 3.3.5.3).
3.3.5.3 Code Tables
Table 3.3-7 - Wavelength Codes
| WLCode | Description |
|---|---|
| 0 | AD wavelengths, ordinary setting |
| 1 | BD wavelengths, ordinary setting |
| 2 | CD wavelengths, ordinary setting |
| 3 | CC’ wavelengths, ordinary setting |
| 4 | AD wavelengths, focused image |
| 5 | BD wavelengths, focused image |
| 6 | CD wavelengths, focused image |
| 7 | CC’ wavelengths, focused image |
| 8 | Used to denote filter ozonemeter instruments |
| 9 | Used to denote Brewer spectrophotometer instruments |
| 10-n | To be defined |
Table 3.3-8 - Observation Codes
| ObsCode | Description |
|---|---|
| 0 or DS | Direct Sun |
| 1 or FM | Focused Moon |
| 2 or ZB | Zenith Blue Sky |
| 3 or ZS | Zenith Cloud (uniform stratified layer of small opacity) |
| 4 or ZS | Zenith Cloud (uniform or moderately variable layer of medium opacity) |
| 5 or ZS | Zenith Cloud (uniform or moderately variable layer of large opacity) |
| 6 or ZS | Zenith Cloud (highly variable layer with or without precipitation) |
| 7 or ZS | Zenith Cloud (fog) |
| 8 or UV | Ozone derived from UV spectrum |
| 9-n | To be assigned by the WOUDC. Data originators are encouraged to contact the WOUDC to register a new code when required. |
| GI | Total ozone value calculated from global irradiance (GI) type of measurement (specifically for Brewer instruments) |
| FS or FZ | Focused Sun |
3.3.5.4 Example
Example format for a TotalOzoneObs data file can be found in Appendix A.4 as well as online at https://woudc.org/archive/Documentation/Examples-extCSV/TotalOzoneObs.csv..
3.3.6 Category: TotalOzone
There are two tables required for the TotalOzone Category: #DAILY, and #MONTHLY/
Table 3.3-9 outlines the tables needed for the category TotalOzone (column Table Name) and their respective field names. In section 3.3.6.1 to section 3.3.6.2, there are more thorough descriptions of whwat each field name for a particular table entails.
Table 3.3-9 - Category TotalOzone data tables
| Table Name | Field (Column) Name (in order) |
|---|---|
#DAILY |
Data, WLCode, ObsCode, ColumnO3, StdDevO3, UTC_Begin, UTC_End, UTC_Mean, nObs, mMu, ColumnSO2 |
#MONTHLY |
Date, ColumnO3, StdDevO3, Npts |
3.3.6.1 DAILY
Date: yyyy - mm - dd
WLCode: Code to designate the wavelength pair(s) used for total ozone measurement. (Refer to Table 3.3-7 in section 3.3.5.3).
ObsCode: Code to designate the type of total ozone measurement. Refer to Table 3.3-8 in section 3.3.5.3.
ColumnO3: Daily value of total column ozone amount (in Dobson Units, i.e., milli atm-cm) defined as the “best representative value”typically in the order of DS, ZS and FM. (Derived from StdDev03 value. Valid range is 100 to 700.)
StdDevO3: Is the estimated population standard deviation of the total column ozone measurements used for the daily value.
UTC_Begin: The starting time of observations (in decimal hours, UTC).
UTC_END: The ending time of observations (in decimal hours, UTC).
UTC_Mean: The mean time of observations (in decimal hours, UTC).
nObs: Number of observations used to calculate the total column ozone value.
mMu: The harmonic mean of the relative slant path through the ozone layer at 22Km ((\mu \ M )) for each of the observations used to compute the daily value. It is a useful statistic in relation to the effects of uncertainties in the zero airmass extrapolations and in the generation of simulated data from independent data. mMu=NN ( \sigma \ \Sigma ) (1/(\mu \ M )).
ColumnSO2: The daily total column sulphur dioxide (SO2) amount calculated as the mean of the individual SO2 amounts (in Dobson Units, i.e., milli-atm-cm) from the same observation used for the O3 amount.
3.3.6.2 MONTHLY
Date: yyyy - mm - dd (The default value is the first day of the month).
ColumnO3: Daily value of total column ozone amount (in Dobson Units, i.e., milli atm-cm) defined as the “best representative value” in order of DS, ZS and FM.
StdDevO3: Standard Deviation of daily total column ozone measurement.
Npts: The number of points (typically this is the number of daily averages) used to estimate the monthly mean ozone value.
3.3.6.3 Example
Example format for a TotalOzone data file can be found in Appendix A.5 as well as online at https://woudc.org/archive/Documentation/Examples-extCSV/TotalOzone-Brewer.csv.
3.3.7 Category: Umkehr14
There are two tables required for the UmkehrN14 Category: #N14_VALUES, and #C_PROFILE.
Table 3.3-10 outlines the tables needed for the category UmkehrN14 (column Table Name) and their respective field names. In section 3.3.7.1 to section 3.3.7.2, there are more thorough descriptions of what each field name for a particular table entails.
Table 3.3-10 - Category UmkehrN14 data tables
| Table Name | Field (Column) Name (in order) |
|---|---|
#DAILY |
Date, H, L, WLCode, ObsCode, ColumnO#, N600, N650, N700, N740, N750, N770, N800, N830, N840, N850, N865, N880, N890, N900 |
#MONTHLY |
`Date, H, L, ColumnO3Obs, ColumnO3Retr, Layer10, Layer9, Layer8, Layer7, Layer6, Layer5, Layer4, Layer3, Layer2, Layer1, ITER, SX, SZA_1, nSZA, DFMRS, FEPS, RMSRES |
3.3.7.1 N14_VALUES
Date: yyyy - mm - dd
H: Code for time of observation: 0=unkown, 1=AM and 2=PM.
L: Code for wavelength pair used for observation:
1=A wavelength pair
2=B wavelength pair
3=C wavelength pair
4=D wavelength pair
5=non sunobservation adjusted to DS observation
WLCode: Code to designate the wavelength pair(s) used for total ozone measurement. Refer to Table 3.3-7 in section 3.3.5.3.
ObsCode: Code to designate the type of total ozone measurement. Refer to Table 3.3-8 in section 3.3.5.3.
ColumnO3: Total amount of column ozone (in Dobson Units, i.e., milli atm-cm) applicable to the Umkehr observation.
N600 to N900: Log(I’/I + constant) to three decimal places (nnn) for the Solar Zenith Angle (_###). The SZA is given to the nearest tenth of a degree with the decimal point omitted. When Log(I’/I + constant) exceeds unity, the integer is omitted. For example: if Log(I’/I + constant)=1.231 then nnn is coded as 231. Missing data are indicated as -1.
!!! md-alert “” Note: The Log(I’/I) + constant} mantissa only to three decimal places. The characteristic of the logarithm is inferred. The n values are given for the corresponding Solar Zenith Angles: 60, 65, 70, 74, 75, 77, 80, 83, 84, 86.5, 88, 89 and 90 degrees.
3.3.7.2 C_PROFILE
Date: yyyy - mm - dd
H: Code for time of observation: 1=AM and 2=PM.
L: Clear zenith=3, Cloudy zenith=5 (used at Station 035, Arosa only)
ColumnO3Obs: Observed total column ozone analogous to TotalOzone (where Dobson Unit is milli-atm-cm).
ColumnO3Retr: Retrieved value for total ozone in Dobson Units. (Sum of retrieved individual layer amounts)
Layer10 - Layer1: Computed layer ozone amount in Dobson Units. The sum of Layers 10-1 = ColumnO3Retr value.
ITER: Number of iterations (2, 3, 4 or 5).
SX: A priori profile error covariance matrix used for processing. Where:
U = Uniform covariance matrix
C = Climatological covariance matrix.
SZA_1: Code used to indicate the first SZA where: 1=60, 2=65 and 3=70 degrees.
NSZA: Number of solar zenith angles: 9, 10, 11 or 12.
DFMRS: RMS fractional retrieval change from last iteration.
FEPS: RMS change in forcing vector from last iteration.
RMSRES: RMS fit residual.
3.3.7.3 Example
Example format for an Umkehr14 data file can be found in Appendix A.6 as well as online at https://woudc.org/archive/Documentation/Examples-extCSV/Umkehr-N_values-Dobson.csv for level 1 and https://woudc.org/archive/Documentation/Examples-extCSV/Umkehr_UMK92Retrieval-Dobson.csv for level 2.
3.4 Ultraviolet Specific Data Content
3.4.1 Introduction
This section discusses the data content of the various categories of ultraviolet data. Each category has a set of defined tables which includes the fields (columns) names, the order of the fields, and the required units. The originator of the data is encouraged to submit any ancillary and/or auxiliary data that he or she may consider relevant. Ancillary data are data describing atmospheric variables and variable site characteristics such as temperature, ozone, pressure, cloud conditions for example by a cloud index or by a sky image, albedo, pyranometer data (information on permanent characteristics of the measuring site). Auxiliary data are characteristics/properties of the instrument that made the measurements, the way in which the instrument was operated, the algorithms that were used to compute the measured values from the instrument signals, etc.. Auxiliary data may be potentially of value to the user or absolutely necessary as when the basic data is raw (Level 0).
3.4.1.1 Spectral
Spectral is radiation that is measured in a continuous spectral band, with a resolution of less than or equal to 2 nm.
3.4.1.2 Multiband
Multiband is measured with several discrete, pass-band filters with nominal spectral resolution of 2-10 nm at FWHM.
3.4.1.3 BroadBand
Broadband is the measurement of UV-A, UV-B, or erythemally weighted UV radiation.
3.4.1.4 Pyranometer
Pyranometer is a measurement of broadband solar irradiance.
3.4.2 Category: Spectral
There are six tables required for the Spectral Category: #GLOBAL, #DIRECT, #DIFFUSE,#ACTINOMETRIC, #GLOBAL_SUMMARY, and #GLOBAL_SUMMARY_NSF.
The #GLOBAL_SUMMARY table is not required if the #GLOBAL_SUMMARY_NSF table is present and the #GLOBAL_SUMMARY_NSF table is not required if the #GLOBAL_SUMMARY table is present.
Table 3.4-1 outlines the tables needed for the category Spectral (column Table Name) and their respective field names. In section 3.4.2.1 to section 3.4.2.4, there are more thorough descriptions of what each field name for a particular table entails.
Table 3.4-1 - Category Spectral data table
| Table Name | Field (Column) Names (in order) |
|---|---|
#GLOBAL |
Wavelength, S-Irradiance, Time |
#DIRECT |
Wavelength, S-Irradiance, Time |
#DIFFUSE |
Wavelength, S-Irradiance, Time |
ACTINOMETRIC |
Wavelength, S-Irradiance, Time |
#GLOBAL_SUMMARY |
Time, IntACGIH, IntCIE, ZenAngle, MuValue, AzimAngle, Flag, TempC, O3, Err_O3, SO2 ,Err_SO2, F324 |
#GLOBAL_SUMMARY_NSF |
Filename, Volume, SZA, Azimuth, Sky_condition, Minimum_useable_wavelength, E290-320, E320-400, UVIndex |
!!! md-alert “” Note: The Time field is in italics to indicate that field position is reserved but not required.
3.4.2.1 GLOBAL
Wavelength: Measured in Nanometres (nm).
S-Irradiance: Is the spectral irradiance measured in Wm^-2 nm^-1
Time: hh:mm:ss in ISO-8601 standard.
3.4.2.2 DIRECT
Refer to #GLOBAL in section 3.4.2.1 for descriptors of the field names for table #DIRECT.
3.4.2.3 DIFFUSE
Refer to #GLOBAL in section 3.4.2.1 for descriptors of the field names for table #DIFFUSE.
3.4.2.4 ACTINOMETRIC
Refer to #GLOBAL in section 3.4.2.1 for descriptors of the field names for table #ACTINOMETRIC.
3.4.2.5 GLOBAL_SUMMARY
Fields O3, Err_O3, SO2, Err_SO2, F324 are optional.
3.4.2.6 Example
Example format for a Spectral data file can be found in Appendix A.7 as well as online at https://woudc.org/archive/Documentation/Examples-extCSV/Spectral.csv.
3.4.3 Category: Multiband
There are five tables required for the Multiband Category: #GLOBAL, #DIRECT, #dIFFUSE, #ACTINOMETRIC, and #SIMULTANEOUS.
Table 3.4-2 outlines the tables needed for the category Multiband (column Table Name) and their respective field names. In section 3.4.3.1 to section 3.4.3.5, there are more thorough descriptions of what each field name for a particular table entails.
Table 3.4-2 - Category Multiband data tables
| Table Name | Field (Column) Name (in order) |
|---|---|
#GLOBAL |
Wavelength, S - Irradiance, Time |
#DIRECT |
Wavelength, S - Irradiance, Time |
#DIFFUSE |
Wavelength, S - Irradiance, Time |
ACTINOMETRIC |
Wavelength, S - Irradiance, Time |
#SIMULTANEOUS |
Wavelength, GLS - Irradiance, DFS - Irradiance, DRS - Irradiance, Time |
!!! md-alert “” Note: The Time, DFS-Irradiance, and DRS-Irradiance fields are in italics to indicate that field position is reserved but not required.
3.4.3.1 GLOBAL
Wavelength: Measured in Nanometres (nm).
S - Irradiance : Is the spectral irradiance measured in Wm^-2 nm^-1
Time: hh:mm:ss in ISO-8601 standard.
3.4.3.2 DIRECT
Refer to #GLOBAL in section 3.4.3.1 for descriptors of the field names for table #DIRECT
3.4.3.3 DIFFUSE
Refer to #GLOBAL in section 3.4.3.1 for descriptors of the field names for table #DIFFUSE
3.4.3.4 ACTINOMETRIC
Refer to #GLOBAL in section 3.4.3.1 for descriptors of the field names for table #ACTINOMETRIC
3.4.3.5 SIMULTANEOUS
Wavelength: Measured in Nanometres (nm).
GLS - Irradiance : Is the global spectral irradiance measured in Wm^-2 nm^-1.
DFS - Irradiance: Is the diffuse spectral irradiance measured in Wm^-2 nm^-1.
DRS - Irradiance: Is the direct spectral irradiance measured in Wm^-2 nm^-1.
Time: hh:mm:ss in ISO-8601 standard.
!!! md-alert “”
Note: The table #SIMULTANEOUS refers to a single detector whereby the measurements are made in a near-simultaneous mode, but reported on the same time scale. For example, measurements are recorded in 15 second intervals, first for global then for diffuse and an integrated value is reported every 15 minutes. This integrated value is considered “simultaneous” for inclusion in this table. Simultaneous measurements made using two or more independent detectors, requires a data file for each detector.
3.4.3.6 Example
Example format for a Multiband data file can be found in Appendix A.8 as well as online at https://woudc.org/archive/Documentation/Examples-extCSV/Multi-band.csv.
3.4.4 Category: Broadband
There are five tables required for the Multiband Category: #GLOBAL, #DIRECT, #dIFFUSE, #ACTINOMETRIC, and #SIMULTANEOUS.
Table 3.4-3 outlines the tables needed for the category Broadband (column Table Name) and their respective field names. In section 3.4.4.1 to section 3.4.4.5, there are more thorough descriptions of what each field name for a particular table entails.
Table 3.4-3 - Category Broadband data tables
| Table Name | Field (Column) Name (in order) |
|---|---|
#GLOBAL |
S - Irradiance, Time |
#DIRECT |
S - Irradiance, Time |
#DIFFUSE |
S - Irradiance, Time |
ACTINOMETRIC |
S - Irradiance, Time |
#SIMULTANEOUS |
Time, GL - Irradiance, DF - Irradiance, DR - Irradiance |
!!! md-alert “” Note: The DF-Irradiance and DR-Irradiance fields are in italics to indicate that field position is reserved but not required.
3.4.4.1 GLOBAL
Time: hh:mm:ss in ISO-8601 standard.
S - Irradiance: Measured in Wm^-2.
3.4.4.2 DIRECT
Refer to #GLOBAL in section 3.4.4.1 for descriptors of the field names for table #DIRECT.
3.4.4.3 DIFFUSE
Refer to #GLOBAL in section 3.4.4.1 for descriptors of the field names for table #DIFFUSE.
3.4.4.4 ACTINOMETRIC
Refer to #GLOBAL in section 3.4.4.1 for descriptors of the field names for table #ACTINOMETRIC.
3.4.4.5 SIMULTANEOUR
Time: hh:mm:ss in ISO-8601 standard.
GL - Irradiance: Is the global irradiance measured in Wm^-2.
DF - Irradiance: Is the diffuse irradiance measured in Wm^-2.
DR - Irradiance: Is the direct irradiance measured in Wm^-2.
!!! md-alert “”
Note: The table #SIMULTANEOUS refers to a single detector whereby the measurements are made in a near-simultaneous mode, but reported on the same time scale. For example, measurements are recorded in 15 second intervals, first for global then for diffuse and an integrated value is reported every 15 minutes. This integrated value is considered “simultaneous” for inclusion in this table. Simultaneous measurements made using two or more independent detectors, requires a data file for each detector.
3.4.4.6 Example
Example format for a Broadband data file can be found in Appendix A.9 as well as online at https://woudc.org/archive/Documentation/Examples-extCSV/Broad-band.csv.
3.4.5 Category: Pyranometer
There are four tables required for the Pyranometer Category: #GLOBAL, #DIRECT, #DIFFUSE, and #ACTINOMETRIC.
Table 3.4-4** outlines the tables needed for the category Pyranometer (column Table Name) and their respective field names. In section 3.4.5.1 to section 3.4.5.4, there are more thorough descriptions of what each field name for a particular table entails.
Table 3.4-4 - Category Pyranometer data tables
| Table Name | Field (Column) Name (in order) |
|---|---|
#GLOBAL |
S - Irradiance, Time |
#DIRECT |
S - Irradiance, Time |
#DIFFUSE |
S - Irradiance, Time |
ACTINOMETRIC |
S - Irradiance, Time |
#SIMULTANEOUS |
Time, GL - Irradiance, DF - Irradiance, DR - Irradiance |
!!! md-alert “” Note: The DF-Irradiance and DR-Irradiance fields are in italics to indicate that field position is reserved but not required.
3.4.5.1 GLOBAL
Time: hh:mm:ss in ISO-8601 standard.
S - Irradiance: Measured in Wm^-2.
3.4.5.2 DIRECT
Refer to #GLOBAL in section 3.4.5.1 for descriptors of the field names for table #DIRECT.
3.4.5.3 DIFFUSE
Refer to #GLOBAL in section 3.4.5.1 for descriptors of the field names for table #DIFFUSE.
3.4.5.4 SIMULTANEOUR
Time: hh:mm:ss in ISO-8601 standard.
GL - Irradiance: Is the global irradiance measured in Wm^-2.
DF - Irradiance: Is the diffuse irradiance measured in Wm^-2.
DR - Irradiance: Is the direct irradiance measured in Wm^-2.
!!! md-alert “”
Note: The table #SIMULTANEOUS refers to a single detector whereby the measurements are made in a near-simultaneous mode, but reported on the same time scale. For example, measurements are recorded in 15 second intervals, first for global then for diffuse and an integrated value is reported every 15 minutes. This integrated value is considered “simultaneous” for inclusion in this table. Simultaneous measurements made using two or more independent detectors, requires a data file for each detector.
3.4.5.5 Example
Example format for Pyranometer data file can be found in Appendix A.10.
3.4.6 Category: Ancillary and Auxiliary Data
The originator of the data is encouraged to submit any ancillary and/or auxiliary data that he or she may consider relevant.
!!! md-alert “” Note: Ancillary and Auxiliary data are best submitted as separate files.
Table 3.4-5 outlines the general table names for ancillary and auxiliary data.
!!! md-alert “” Note: The tables are shown with sample fields which may be included in any of the UV categories.
Table 3.4-5 -Sample Ancillary and Auxiliary data
| Table Name | Suggested field names |
|---|---|
#CALIBRATION |
Specified by the data originator (Scientific Authority) |
#METEOROLOGY |
Temperature, Pressure, Relative Humidity |
METEOROLOGY_SUMMARY |
Time, Temperature, Pressure, Relative Humidity |
SURFACE_CONDITIONS |
Albedo, Comments about Surface cover (Example: “Snow” or “Shrubland” or “Grassland”) |
IMAGE |
Filename, Comments (Example: sky97001.gif) |
Table 3.4-6 lists all the required and optional field names for the WOUDC data submissions along with comments and their physical units [6].
Table 3.4-6 - Field Names
| Field Name | Physical Units | Comments |
|---|---|---|
| Albedo | Dimensionless | No comments |
| Cloud Amount | No units | Special codes |
| Date | yyyy-mm-dd | ISO-8601 standard |
| DF - Irradiance | Wm^-2 | Diffuse Irradiance |
| DFS - Irradiance | Wm^-2 nm^-1 | Diffuse Spectral Irradiance |
| DR - Irradiance | Wm^-2 | Direct Irradiance |
| DRS - Irradiance | Wm^-2 nm^-1 | Direct Spectral Irradiance |
| GL - Irradiance | Wm^-2 | Global Irradiance |
| GLS - Irradiance | Wm^-2 nm^-1 | Global Spectral Irradiance |
| Height | Meters (m) | Above sea level |
| Image filename and -path | No units | *.bmp, *.gif, *.jpeg etc. |
| Irradiance | Wm^-2 | No comments |
| Irradiation | KJ m^-2 m,^-1 | Daily integrated irradiance |
| Latitude | Decimal degrees | North is positive |
| Longitude | Decimal degrees | East is positive |
| Pressure | Hecto-Pascal (hPa) | No comments |
| RelativeHumidity | Dimensionless (%) | No comments |
| S- Irradiance | Wm^-2 nm^-1 | Spectral Irradiance |
| S - Irradiation | KJm^-2 | Spectral Irradiation |
| Time | hh:mm:ss | ISO-8601 standard |
| Temperature | Degrees Celsius (°C) | No comments |
| Wavelength | Nanometres (nm) | No comments |
| WindSpeed | ms^-1 | No comments |
| WindDirection | Decimal degrees | No comments |
3.5 Software
The following free software exist to help in the creation of Extended CSV files:
-
o3soft: Contributors with Brewer and Dobson spectrophotometers can use this software to export Extended CSV
-
woudc-formats: Contributors with SHADOZ, NASA AMES 2160 or Vaisala data can use this Python package to convert into Extended CSV
Chapter 4 Data Handling
4.1 Data Policy
Use of the WOUDC data are governed by the WMO data policy and WMO GAW data use policy. More information about WOUDC’s data policy can be found online.
4.2 Data Flow and Processing
Section 2.3 provides detailed procedures regarding data processing. Successfully ingested data submissions are made available to the WAF, geospatial web services and search.
Essentially, data from contributors is received, processed, and archived. Once file is inputted into the system, the backend process is instantiated where the incoming file type is identified and validated to make sure it is in the standard WOUDC file format (extCSV). Once the file has been identified as valid extCSV, the system tries to create and validate the taxonomy and URI for the file. Next the file will undergo a rigorous set of validations called File Level Validation (FLV). FLV is used to ensure:
- extCSV conforms syntactically to GAW-WOUDC specifications
- metadata validation which makes sure the values contained in the headers (
#TIMESTAMP,#PLATFORM,#INSTRUMENT,#CONTENT,#DATA_GENERATION,#LOCATION) are accurate and consistent - unique table validation which are sets of tests used to validate dataset specific tables
- values are modified in accordance with “no-touch” policy (i.e., minimal syntactical updates)
The extCSV that emerges once it has gone through FLV is a clean version of the original form. Once the extCSV has successfully passed the taxonomy validation, URI validation, and FLV, the files is ready to be ingested into the database. Any errors compiled throughout the process are provided to the contributor in order to help remediate the errors for an easier ingestion of their data.
Chapter 5 Data Quality
Once a file has been submitted to the WOUDC, data quality is monitored at various stages during data processing. Quality control consists of checking for file format and metadata content, inspection of data value ranges, and data redundancy checks.
At a high level, the following is a summary of QA checks performed:
Structural Validation
- Checks if the incoming extCSV file conforms to the extCSV specification - Checks the format of the file
- Checks all tables and fields in the file, etc.
Metadata Validation
- Checks that all metadata (agency, station, instrument, etc.) is correct
- Corrects any missing of incorrect metadata wherever possible
Data Validation
- Checks that all dates in the file are consistent (e.g. the generation date of the file does not precede the observation date, etc.)
- Checks the derived values in the file (e.g. TotalOzone
#MONTHLYvalues) - Corrects if the values are wrong; fills in if missing
Initially, a file will be tested for adherence to the file format specifications, but later, higher level statistical summaries may be generated, which identify anomalous values, calibration problems, etc.. Although the later examples involve more detailed knowledge of the data, the archive already includes enough data to make some critical judgments and general assessments about the data. As the volume and statistical knowledge increase, the scope of these assessments will be broadened.
Chapter 6 Access and Data Retrieval
Data access and retrieval are core capabilities of the WOUDC. The WOUDC data is freely available for public use. For more information, see the WOUDC Data Access page.
Chapter 7 Contact
The primary means of contacting the WOUDC is by the contact page on the WOUDC site, which is monitored on a daily basis by data centre operations. WOUDC operates with a service standard to response to all email inquiries within 2 business days.
7.1 Contact Page
https://woudc.org/contact.php.
7.2 Address
World Ozone and Ultraviolet Radiation Data Centre
Meteorological Service of Canada
Environment and Climate Change Canada
4905 Dufferin Street
Toronto, ON M3H 5T4
Canada
Chapter 8 References
[1] User Guide to the WMO/GAW World Ozone Data Centre Version 3.1, Environment Canada publication, 2013.
[2] Guide to the WMO/GAW World Ultraviolet Radiation Data Centre Version 6.0, Environment Canada publication, 2006.
[3] Gaines, S.E. and R.S. Hipskind, Format Specification for Data Exchange Version 1.0, NASA Ames Research Center publication, 1990.
[4] Gaines, S.E. and R.S. Hipskind, Format Specification for Data Exchange Version 3.1, NASA Ames Research Center publication, 1998.
[5] Ruffieux, D., Personal communication, 2006
[6] R. Dogniaux, et al., “Solar Meteorology: Units and Symbols”: Int. J. Solar Energy, 1984, volume 2 number 3, pages 249-255.
Appendix A Examples
A.1 Lidar Example
Below is an example of a Lidar data submission. An example can also be found online at https://woudc.org/archive/Documentation/Examples-extCSV/Lidar.csv.
`*NOTE:One Event per file
* This file was generated by NA2110LI - version 1.0.
* Originating NASA-Ames file: NDSC\EUREKA\euo39302.cal
* --- NASA-Ames MNAME ---
* NDSC
#CONTENT
Class,Category,Level,Form
WOUDC,Lidar,1.0,1
#DATA_GENERATION
Date,Agency,Version,ScientificAuthority
1993-12-14,CRESTech,0.0,"(Carswell, A. I.), (carswell@lidar.ists.ca) 416-665-5418"
#PLATFORM
Type,ID,Name,Country,GAW_ID
STN,315,Eureka,CAN
#INSTRUMENT
Name,Model,Number
DIAL,Lotard,1
* --- NASA-Ames SCOM ---
* Data processed using version 2.0 software
* --- NASA-Ames NCOM ---
* Temperature and Density data above about 25 Km
* is lidar derivied. Temperature and density below
* 15-25 Km (maximum sonde height) is that given
* by the nearest in time Eureka radiosonde.
* Between the maximum sonde height up to
* around 25 Km the temperature and denisty is
* estimated by interpolationg between the sonde
* and lidar values.
#LOCATION
Latitude,Longitude,Height
80,-85.9,607
#TIMESTAMP
UTCOffset,Date,Time
+00:00:00,1993-02-10,13:11:00
#OZONE_SUMMARY
Altitudes,MinAltitude,MaxAltitude,StartDate,StartTime,EndDate,EndTime,PulsesAveraged
112,12150,45430,1993-02-10,13:11:00,,,1.26e+006
#OZONE_PROFILE
Altitude,OzoneDensity,StandardError,RangeResolution,AirDensity,Temperature
12150.,2.428e+012,4.67e+010,1000
12450.,2.761e+012,4.82e+010,1000
12750.,2.996e+012,5.02e+010,1000
… etc
A.2 Microwave Example
Below is an example of a Microwave data submission.
*NOTE: One Event per file

* This file was originally received in NASA-Ames 2110 format and has been
* translated into WOUDC extCSV format using converter software XXX ver xx
*
* --------------------------------------------------------------
* NOTE: Original file header information is appended at the end of this file.
* --------------------------------------------------------------
*

#CONTENT
Class,Category,Level,Form
WOUDC,Microwave,1.0,1

#DATA_GENERATION
Date,Agency,Version,ScientificAuthority
2006-07-01,Meteoswiss,1.0,Dominique Ruffieux

#PLATFORM
Type,ID,Name,Country,GAW_ID
STN,156,Payerne,CHE

#INSTRUMENT
Name,Model,Number
SOMORA,???,???

#LOCATION
Latitude,Longitude,Height
46.82,6.95,491

* Observing technique: total power
* Center frequency: 142.175 GHz
* Inversion method: Optimal Estimation
* Temp. and press. profiles : CIRA 86 + daily NCEP + Payerne radiosondes
* A-priori profile: season standard atmosphere
* Measurement Error Cov.: variable, adjusted to wings BT
* A Priori Error Cov.: 0 - 1.5 ppm (correlation 3-5 km)

#TIMESTAMP
UTCOffset,Date,Time
+0:00:00,2005-10-09,00:18:00

*282.01 25 2005 10 9 0 18 30 46.82 6.95 491 52.0 2741 0.57 0.13
#PROFILE_SUMMARY
Levels,AveragingTime,ZenithAngle,NoiseTemperature,TTF,CalculatedSpectrum
25,30,52.0,2741,0.57,0.13

#OZONE_PROFILE
Altitude,OzoneVMR,VariableError,FixedError,SmoothingError,TotalError,A-Priori,
Temperature,Pressure
13000,0.40,0.01,0.05,0.28,0.29,18,213.75,172.92
15000,0.69,0.03,0.12,0.43,0.45,18,214.17,125.88
17000,1.29,0.05,0.18,0.44,0.48,17,213.04,91.56
…
73500,0.56,0.03,0.02,0.11,0.12,64,216.68,,0.03
76500,0.54,0.02,0.01,0.10,0.10,73,214.20,,0.02

#TIMESTAMP
UTCOffset,Date,Time
+0:00:00,2005-10-09,00:48:00

*282.03 25 2005 10 9 0 48 30 46.82 6.95 491 52.0 2748 0.57 0.13
#PROFILE_SUMMARY
Levels,AveragingTime,ZenithAngle,NoiseTemperature,TTF,CalculatedSpectrum
25,30,52.0,2748,0.57,0.13

#OZONE_PROFILE
Altitude,OzoneVMR,VariableError,FixedError,SmoothingError,TotalError,A-Priori,
Temperature,Pressure
13000,0.42,0.01,0.05,0.28,0.29,18,213.75,172.92
15000,0.74,0.03,0.11,0.43,0.45,17,214.17,125.88
17000,1.34,0.05,0.18,0.44,0.48,17,213.04, 91.56
…
70500,0.59,0.05,0.03,0.14,0.15,56,219.34,,0.04
73500,0.56,0.03,0.02,0.11,0.12,65,216.68,,0.03
76500,0.53,0.02,0.01,0.10,0.10,74,214.20,,0.02

etc ...

#TIMESTAMP
UTCOffset,Date,Time
+0:00:00,2005-10-09,23:47:00

*282.99 25 2005 10 9 23 47 25 46.82 6.95 491 52.0 2740 0.63 0.18
#PROFILE_SUMMARY
Levels,AveragingTime,ZenithAngle,NoiseTemperature,TTF,CalculatedSpectrum
25,25,52.0,2740,0.63,0.18

#OZONE_PROFILE
Altitude,OzoneVMR,VariableError,FixedError,SmoothingError,TotalError,A-Priori,Temperature,Pressure
13000,0.34,0.01,0.04,0.28,0.29,24,211.78,174.52
15000,0.53,0.03,0.11,0.43,0.44,22,212.61,126.65
17000,1.01,0.05,0.16,0.43,0.46,21,211.64, 91.94
…
70500,0.55,0.06,0.03,0.14,0.15,56,219.34,,0.04
73500,0.53,0.03,0.02,0.11,0.12,66,216.68,,0.03
76500,0.52,0.02,0.01,0.10,0.10,76,214.20,,0.02

* RUFFIEUX D.,,,, MWAVE,,, PAYERNE,, OZONE,,, 09-Oct-2005 00:18:0009-Oct-2005 23:47:001001
* 47 2110
* RUFFIEUX, Dominique
* MeteoSwiss, Station Aerologique de Payerne, Switzerland
* Stratospheric Ozone Monitoring Radiometer (SOMORA) / Payerne
* NDSC / GAW
* 1 1
* 2005 10,9 2005 10 10
* 0.0 0.0
* Altitude (m)
* Fractional day (day of year)
* 8
* 1 1 1 1 1 1 1 100
* 99.99 99.99 99.99 99.99 99.99 999 999.99 9999.99
* Ozone VMR (ppm)
* Variable (stochastic) error for ozone VMR (ppm)
* Fixed (systematic) error for ozone VMR (ppm)
* Smoothing error (ppm)
* Total error (ppm)
* A-priori data contribution (%)
* Temperature profile used for retrieval (K)
* Pressure profile used for retrieval (Pa)
* 14
* 1 1 1 1 1 1 1 1 1 1 1 1 1 1
* 99 9999 99 99 99 99 999 99.99 99.99 999 99 9999 9.99 9.99
* Number of altitudes recorded in subsequent data records
* Year
* Month
* Day
* Hour (Time=UT)
* Minutes
* Averaging Time (Minutes)
* Latitude (Deg. north)
* Longitude (Deg. east)
* Altitude above sea level (m)
* Zenith angle (Deg.)
* Mean system noise temperature (K)
* Tropospheric Transmission Factor
* Std. of Meas. - Calc. Spectrum (K)
* 0
* 7
* Observing technique: total power
* Center frequency: 142.175 GHz
* Inversion method: Optimal Estimation
* Temp. and press. profiles : CIRA 86 + daily NCEP + Payerne radiosondes
* A-priori profile: season standard atmosphere
* Measurement Error Cov.: variable, adjusted to wings BT
* A Priori Error Cov.: 0 - 1.5 ppm (correlation 3-5 km)
A.3 Ozonesonde Example
Below is an example of an Ozonesonde data submission. An example can also be found online at https://woudc.org/archive/Documentation/Examples-extCSV/Ozonesonde.csv.
#CONTENT
Class,Category,Level,Form
WOUDC,OzoneSonde,1.0,2

#DATA_GENERATION
Date,Agency,Version,ScientificAuthority
2013-02-11, Environment Canada,1.0,Jonathan Davies

#PLATFORM
Type,ID,Name,Country,GAW_ID
STN,21,Stonyplain,CAN

#INSTRUMENT
Name,Model,Number
ECC,Z,Z14850

#LOCATION
Latitude,Longitude,Height
53.54,-114.1,766

#TIMESTAMP
UTCOffset,Date,Time
+00:00:00,2013-01-30,11:16:00

*EXAMPLE OF NEW OZONESONDE
*FILE FORMAT*
* ----- correction applied for 1% KI solution in ENSCI sonde ----------
* ----- correction applied for 2.5 cc of solution instead of 3.0 ---
* ----- residual ozone interpolated from 2011 MLS climatology (McPeters and Labow) ---

#PREFLIGHT_SUMMARY
ib0,ib1,1b2,SolutionType,SolutionVolume,PumpFlowRate,OzoneSondeResponseTime
0.1,0.04,0.04,1%KIFullBuffer,2.5,214.36,0.34

#RADIOSONDE
Manufacturer,Model,Number
Vaisala,RS92-SGP,H0513477

#INTERFACE_CARD
Manufacturer,Model,Number
Vaisala,RSA921,G14513056

#SAMPLING_METHOD
TypeOzoneFreeAir,CorrectionWettingFlow,SurfaceOzone, LengthBG,WMOTropopausePressure,BurstOzonePressure,GroundEquipment,ProcessingSoftware
activated charcoal filter,0.98,20,30,295,13.099,DigiCORA III,SNDPRO 2.0

#PUMP_SETTINGS
MotorCurrent,HeadPressure,VacuumPressure
79.9,1600,200

#PUMP_CORRECTION
Pressure,Correction
2,1.16,
3,1.124
5,1.087,
10,1.054
20,1.033
30,1.024
50,1.015
100,1.01
200,1.007
300,1.005
500,1.002
1000,1.0

#FLIGHT_SUMMARY
IntegratedO3,CorrectionCode,SondeTotalO3,NormalizationFactor,BackgroundCorrection,SampleTemeratureType
318.5,6,404.3,-0.984,Pressure_ib2,Pump_Intern

#OZONE_REFERENCE
Name,Model,Number,Version,TotalO3,WLCode,ObsType,UTC_Mean
Brewer,Single,55,1,398,9,0,19.6

#PROFILE
Duration,Pressure,O3PartialPressure,Temperature,WindSpeed,WindDirection,LevelCode,GPHeight,RelativeHumidity,SampleTemperature,SondeCurrent,PumpMotorCurrent,PumpMotorVoltage,Latitude,Longitude,Height
0,924.59,1.973,-23.1,2.6,360,2,766,76,36.6,0.566924
2,924.13,1.973,-23.2,2.2,350,0,770,72,36.6,0.566904
4,923.46,1.992,-23.4,2.6,349,0,774,72,36.6,0.572229
6,922.56,1.992,-23.5,3,350,0,783,73,36.6,0.572192
8,921.21,1.982,-23.6,3.3,350,0,793,74,36.6,0.569459
10,919.86,1.981,-23.7,3.6,350,0,803,75,36.6,0.569403
...
7510,20.11,13.167,-61.2,13.2,64,0,26282,1,11.7,3.89304
7512,20.09,13.205,-61.1,13,64,0,26287,1,11.7,3.90423
7514,20.07,13.186,-61.1,12.8,64,0,26293,1,11.7,3.89851
7516,20.05,13.176,-61,12.6,65,0,26300,1,11.6,3.89697
7518,20.02,13.175,-60.9,12.4,65,0,26307,1,11.6,3.89685
7520,20,13.099,-61,12.2,65,2,26314,1,11.6,3.87421


#PROFILE_UNCERTAINTY
Duration,Pressure,O3PartialPressure,Temperature,WindSpeed,WindDirection,LevelCode,GPHeight,RelativeHumidity,SampleTemperature,SondeCurrent,PumpMotorCurrent,PumpMotorVoltage,Latitude,Longitude,Height

!!! md-alert ""
    **Note:** At present this is a placeholder for estimated uncertainty for each of the measured profile parameters listed here. Guidelines for this will be released probably first in 2014/2015
A.4 TotalOzoneObs Example
Below is an example of TotalOzoneObs data submission. An example can also be found online at https://woudc.org/archive/Documentation/Examples-extCSV/TotalOzoneObs.csv.
*Example of a single day of observations
*One observation day per file
#CONTENT
Class,Category,Level,Form
WOUDC,TotalOzoneObs,1.0,1
#DATA_GENERATION
Date,Agency,Version,ScientificAuthority
1999-05-07,MSC,1.0,J. Kerr
#PLATFORM
Type,ID,Name,Country,GAW_ID
STN,065,Toronto,CAN,71638
#INSTRUMENT
Name,Model,Number
Brewer,MKII,014
#LOCATION
Latitude,Longitude,Height
43.78,-79.47,198
#TIMESTAMP
UTCOffset,Date,Time
+00:00:00,1999-04-10
#OBSERVATIONS
Time,WLcode,ObsCode,Airmass,ColumnO3,StdDevO3,ColumnSO2,StdDevSO2
10:03:01,9,DS,2.39,350.0,2.0,1.13,0.02
10:25:11,9,DS,2.35,351.2,1.9,0.98,0.02
11:13:01,9,DS,2.21,348.4,1.5
…
17:03:23,9,DS,2.89,350.0,2.0,1.13,0.08
17:25:01,9,DS,2.99,350.8,2.2
17:50:01,9,DS,3.09,355.0,2.3
18:09:51,9,DS,3.29,351.4,2.7,2.13,0.6
#DAILY_SUMMARY
WLcode,ObsCode,nObs,MeanO3,StdDevO3
9,DS,9,350.0,2.0
A.5 TotalOzone Example
Below is an example of TotalOzone data submission. An example can also be found online at https://woudc.org/archive/Documentation/Examples-extCSV/TotalOzone-Brewer.csv.
*Example of daily ozone values
*One month per file
#CONTENT
Class,Category,Level,Form
WOUDC,TotalOzone,1.0,1
#DATA_GENERATION
Date,Agency,Version,ScientificAuthority
1999-06-07,MSC,1.0,J. Kerr
#PLATFORM
Type,ID,Name,Country,GAW_ID
STN,065,Toronto,CAN,71638
#INSTRUMENT
Name,Model,Number
Brewer,MKII,014
#LOCATION
Latitude,Longitude,Height
43.78,-79.47,198
* NOTE: the date defaults to the first day of the month.
#TIMESTAMP
UTCOffset,Date,Time
+00:00:00,1999-04-01
* Precipitation on April 2, 28, 29
#DAILY
Date,WLCode,ObsCode,ColumnO3,StdDevO3,UTC_Begin,UTC_End,UTC_Mean,nObs,mMu,ColumnS
O2
1999-04-01,9,0,350.0,5.0,,,13.75,27,1.28,5.13
1999-04-03,9,0,341.1,4.1,,,12.75,19,1.12
1999-04-04,9,0,353.8,3.0,,,13.01,35,1.2
…
1999-04-26,9,0,355.0,5.0,,,13.05,37,1.21,3.33
1999-04-27,9,0,355.0,5.0,,,12.66,37,1.19
1999-04-30,9,0,369.0,5.0,,,13.7,25,1.3
#TIMESTAMP
UTCOffset,Date,Time
+00:00:00,1999-04-30
* NOTE: the date of the MONTHLY table defaults to the first day of the month.
#MONTHLY
Date,ColumnO3,StdDevO3,Npts
1999-04-01,350.0,5.0,13
A.6 UmkkehrN14 Example
Below is an example of an UmkehrN14 data submission. An example can also be found online at https://woudc.org/archive/Documentation/Examples-extCSV/Umkehr-N_values-Dobson.csv for level 1.0 https://woudc.org/archive/Documentation/Examples-extCSV/Umkehr_UMK92Retrieval-Dobson.csv and for level 2.0.
*NOAA-CMDL is the Agency acronym for the National Oceanographic and
*Atmospheric Administration-Climate Monitoring and Diagnostics Laboratory

*One month per file

#CONTENT
Class,Category,Level,Form
WOUDC,UmkehrN14,1.0,1

#DATA_GENERATION
Date,Agency,Version,ScientificAuthority
1996-07-02,NOAA_CMDL,1.0, Gloria Koenig

#PLATFORM
Type,ID,Name,Country,GAW_ID
STN,067,Boulder,USA

#INSTRUMENT
Name,Model,Number
Dobson,Beck,082

#LOCATION
Latitude,Longitude,Height
40.03,-105.25,832

#TIMESTAMP
UTCOffset,Date,Time
-07:00:00,1992-10-07

#N14_VALUES
Date,H,L,WLCode,ObsCode,ColumnO3,N600,N650,N700,N740,N750,N770,N800,N830,N840,N850,N865,N880,N890,N900
1992-10-07,1,1,0,0,268,-1,145,356,572,627,746,913,957,942,916,844,763,705,630
1992-10-07,1,3,0,0,268,467,538,645,768,800,877,44,231,295,343,363,344,316,271
1992-10-07,1,4,0,0,268,208,244,292,254,371,416,504,629,681,734,817,893,920,917
1992-10-07,2,1,0,0,244,-1,145,356,572,627,746,913,957,942,916,844,763,705,630
1992-10-07,2,3,0,0,244,467,538,645,768,800,877,044,231,295,343,363,344,316,271
…
1992-10-28,1,1,0,0,268,-1,145,356,572,627,746,913,957,942,916,844,763,705,630
1992-10-28,1,3,0,0,268,467,538,645,768,800,877,44,231,295,343,363,344,316,271
1992-10-28,1,4,0,0,268,208,244,292,254,371,416,504,629,681,734,817,893,920,917
1992-10-28,2,1,0,0,244,-1,145,356,572,627,746,913,957,942,916,844,763,705,630
1992-10-28,2,3,0,0,244,467,538,645,768,800,877,044,231,295,343,363,344,316,271

#TIMESTAMP
UTCOffset,Date,Time
-07:00:00,1992-10-28

#METEOROLOGY
Temperature,Pressure,Relative Humidity
,1642
A.7 Spectral Example
Below is an example of a Spectral data submission. An example can also be found online at https://woudc.org/archive/Documentation/Examples-extCSV/Spectral.csv.
#CONTENT
Class,Category,Level,Form
WOUDC,Spectral,1.0,1

#DATA_GENERATION
Date,Agency,Version,ScientificAuthority
2009-02-12,JMA,1.0,Head of Ozone Layer Monitoring Office

#PLATFORM
Type,ID,Name,Country,GAW_ID
STN,014,Tsukuba(Tateno),JPN,47646

#INSTRUMENT
Name,Model,Number
Brewer,MKIII,173

#LOCATION
Latitude,Longitude,Height
36.06,140.13,31

* Provisional

* by UV routine; back and forth scan between 290nm and 325nm

#TIMESTAMP
UTCOffset,Date,Time
+09:00:00,2009-01-01,07:00:02

#GLOBAL_SUMMARY
Time,IntACGIH,IntCIE,ZenAngle,MuValue,AzimAngle,Flag,TempC
07:00:02,3.108E-05,1.737E-04,89.10,11.86,119.68,,13.2

#GLOBAL
Wavelength,S-Irradiance,Time
290.0,0.000E+00
290.5,0.000E+00
291.0,0.000E+00
291.5,0.000E+00
292.0,0.000E+00
292.5,0.000E+00
293.0,0.000E+00
293.5,0.000E+00
294.0,0.000E+00
294.5,0.000E+00
295.0,0.000E+00

#TIMESTAMP
UTCOffset,Date,Time
+09:00:00,2009-01-01,07:59:58

#GLOBAL_SUMMARY
Time,IntACGIH,IntCIE,ZenAngle,MuValue,AzimAngle,Flag,TempC
07:59:58,4.376E-04,2.565E-03,79.11,4.86,129.23,,14.0

#GLOBAL
Wavelength,S-Irradiance,Time
290.0,0.000E+00
290.5,0.000E+00
291.0,0.000E+00
291.5,0.000E+00
292.0,0.000E+00
292.5,0.000E+00
293.0,0.000E+00
293.5,0.000E+00
294.0,0.000E+00
294.5,0.000E+00
295.0,0.000E+00

#TIMESTAMP
UTCOffset,Date,Time
+09:00:00,2009-01-01,08:59:31

#GLOBAL_SUMMARY
Time,IntACGIH,IntCIE,ZenAngle,MuValue,AzimAngle,Flag,TempC
08:59:31,1.695E-03,9.518E-03,70.56,2.92,140.33,,14.4

#GLOBAL
Wavelength,S-Irradiance,Time
290.0,0.000E+00
290.5,0.000E+00
291.0,0.000E+00
291.5,0.000E+00
292.0,0.000E+00
292.5,0.000E+00
293.0,0.000E+00
293.5,0.000E+00
294.0,0.000E+00
294.5,0.000E+00
295.0,0.000E+00

#TIMESTAMP
UTCOffset,Date,Time
+09:00:00,2009-01-01,10:00:04

#GLOBAL_SUMMARY
Time,IntACGIH,IntCIE,ZenAngle,MuValue,AzimAngle,Flag,TempC
10:00:04,3.722E-03,1.982E-02,63.87,2.24,153.58,,14.9

#GLOBAL
Wavelength,S-Irradiance,Time
290.0,0.000E+00
290.5,0.000E+00
291.0,0.000E+00
291.5,0.000E+00
292.0,0.000E+00
292.5,0.000E+00
293.0,0.000E+00
293.5,0.000E+00
294.0,0.000E+00
294.5,0.000E+00
A.8 Multiband Example
Below is an example of a Multiband data submission. An example can also be found online at https://woudc.org/archive/Documentation/Examples-extCSV/Multi-band.csv.
#CONTENT
Class,Category,Level,Form
WOUDC,Multi-band,1.0,1

#DATA_GENERATION
Date,Agency,Version,ScientificAuthority
2006-09-08,USDA_CSU,3.0,James R. Slusser

#PLATFORM
Type,ID,Name,Country,GAW_ID
STN,256,Lauder,NZL

#INSTRUMENT
Name,Model,Number
Yankee,UVMFR-7,231

#LOCATION
Latitude,Longitude,Height
-45.038,169.684,370

#TIMESTAMP
UTCOffset,Date,Time
12:00:00,2006-01-01
* The direct normal, the diffuse horizontal and the total horizontal
* radiation have been corrected for the measured angular response of
* each channel of the detectors.  Diffuse horizontal corrections were
* made assuming an isotropic distribution of sky radiance.

#SIMULTANEOUS
Wavelength,GLS-Irradiance,DFS-Irradiance,DRS-Irradiance,Time,Airmass,SZA
299.96,,,,05:00:00,37.3375,89.96
305.36,,,,05:00:00,37.3375,89.96
311.53,,,,05:00:00,37.3375,89.96
317.63,,,,05:00:00,37.3375,89.96
325.34,,,,05:00:00,37.3375,89.96
332.46,,,,05:00:00,37.3375,89.96
367.92,,,,05:00:00,37.3375,89.96
299.96,,,,05:03:00,33.1052,89.65
305.36,,,,05:03:00,33.1052,89.65
311.53,,,,05:03:00,33.1052,89.65
317.63,,,,05:03:00,33.1052,89.65
325.34,,,,05:03:00,33.1052,89.65
332.46,,,,05:03:00,33.1052,89.65
367.92,,,,05:03:00,33.1052,89.65
299.96,0.000000,0.000000,0.000000,05:06:00,29.2088,89.30
305.36,0.000000,0.000000,0.000000,05:06:00,29.2088,89.30
311.53,0.000199,0.000199,0.000000,05:06:00,29.2088,89.30
317.63,0.000000,0.000000,0.000000,05:06:00,29.2088,89.30
325.34,0.002551,0.002551,0.000000,05:06:00,29.2088,89.30
…
A.9 Broadband Example
Below is an example of a Broadband data submission. An example can also be found online at https://woudc.org/archive/Documentation/Examples-extCSV/Broad-band.csv.
* UV dekodavimas ExtCSV formavimas, V 1.018 beta

#CONTENT
Class,Category,Level,Form
WOUDC,Broad-band,1.0,1

#DATA_GENERATION
Date,Agency,Version,ScientificAuthority
2009-02-10,LHMS,1.0,Tomas Zumaras

#INSTRUMENT
Name,Model,Number
UV-Biometer,501A,4399

#PLATFORM
Type,ID,Name,Country,GAW_ID
STN,312,Kaunas,LTU

#LOCATION
Latitude,Longitude,Height
54.53,23.50,76.1

#TIMESTAMP
UTCOffset,Date
+03:25:00,2009-01-01

#GLOBAL
Time,Irradiance
00:00:00,0.0000000
00:05:00,0.0000000
00:10:00,0.0000000
00:15:00,0.0000000
00:20:00,0.0000000
00:25:00,0.0000000
00:30:00,0.0000000
00:35:00,0.0000000
00:40:00,0.0000000
00:45:00,0.0000000
00:50:00,0.0001749
00:55:00,0.0000000
01:00:00,0.0000000
01:05:00,0.0000000
01:10:00,0.0000000
…
A.10 Pyranometer Example
Below is an example of a Pyranometer data submission.
* Data file 2 Pyranometer Data (Global)
#CONTENT
Name,Category,Level,Form
WOUDC,Pyranometer,1.0,1

#DATA_GENERATION
Date,Agency,Version,ScientificAuthority
1997-07-02,AES,1.0,Bruce McArthur

#INSTRUMENT
Name,Model,Number
Kipp and Zonen,CM21,920065

#PLATFORM
Type,ID,Name,Country,GAW_ID
STN,338,Regina,CAN,72863

#LOCATION
Latitude,Longitude,Height
50.21,-104.71,592

#TIMESTAMP
UTCOffset,Date,Time
-06:59:08,1997-06-08
* In this example, the pyranometer data are concatenated into one table
*(#GLOBAL), with a single #TIMESTAMP table. The #METEOROLOGY and
*#INSTRUMENT_CONDITIONS_SUMMARY tables are a summary.

#GLOBAL
Time,Irradiance
06:45:00,201
07:00:00,212
07:15:00,243
…
22:00:00,244

#METEOROLOGY_SUMMARY
Time,Temperature,Pressure,RelativeHumidity
07:00:00,15,972
08:00:00,16,973
…

#INSTRUMENT_CONDITIONS_SUMMARY
Time,Temperature
06:45:00,15.8
07:00:00,16.0
…
- Version:
- 2.1.3